For online payments please call our Finance Team on 01524 521321
Gender Pay Gap Report 2023/24 (as at 31 March 2024)
GENERAL EXPLANATORY NOTES:
- ‘Gender Pay Gap’ (GPG) is not the same as ‘Equal pay’. The latter refers to the difference between men and women’s pay for the same job, and is illegal; whereas the gender pay gap relates to the difference calculated between average earnings, irrespective of their roles in any given sector, and is a way of measuring gender equality in respect of equal access to, and take up of, all types and levels of roles within an organisation.
- All calculations have been made as at 31 March 2024, in line with Government requirements for Public Sector bodies.
- Lancaster & Morecambe College does not have a bonus pay scheme for any staff, so reporting requirements for bonuses are not applicable.
- The mean calculation shows the difference between the mean average hourly rate of pay that male and female employees receive. Mean averages (division of total sum of all values by number of values) are useful because they place the same value on every number used, giving a good overall indication of the gender pay gap; however, very large or small pay rates can ‘dominate’ and distort the answer.
- The median calculation shows the difference between the median hourly rate of pay that male and female full-pay relevant employees receive. Median averages (middle point in a list of all values from smallest to largest) are useful to indicate what the ‘typical’ situation is i.e. in the middle of an organisation, and are not distorted by very large or small pay rates or bonuses. However, this means that not all gender pay gap issues will be picked up.
- Using these two different types of average is helpful to give a more balanced overview of an employer’s gender pay gap.
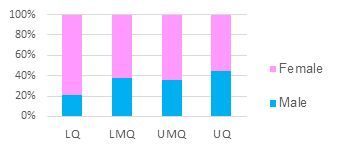
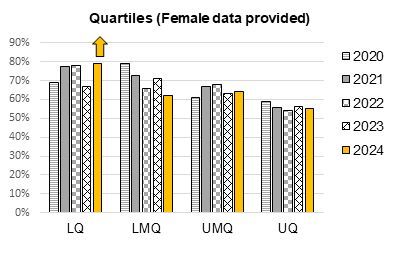
- Quartiles: comparing the two results in each quartile will indicate the distribution of male and female employees in the quartile. Comparing results between the quartiles will indicate the distribution of male and female employees across the organisation.
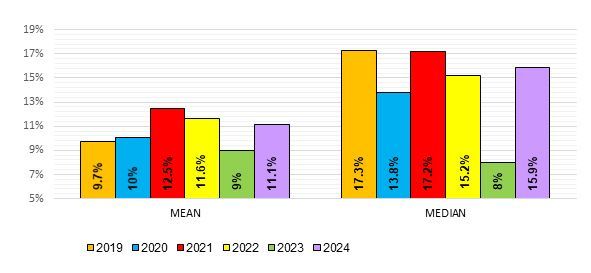
MEAN AVERAGE LMC Mean Gender Pay Gap is: 11.1%
MEDIAN AVERAGE LMC Median Gender Pay Gap is: 15.9%

QUARTILES
| Male | Female | |
| Lower Quartile | 21% | 79% |
| Lower Middle Quartile | 38% | 62% |
| Upper Middle Quartile | 36% | 64% |
| Upper Quartile | 45% |
55% |


NOTE:
Quartile data is part of our statutory reporting requirement; it also demonstrates one reason for an increase in GPG in 2024. The proportion of female staff in the lower quartile has increased to its highest level in 5 years, mitigated slightly by the equivalent drop in proportion of females in the next quartile (lower middle).
CAUSAL ANALYSIS: what has contributed to the increases?
Analysis of the Mean GPG; This year’s data could be seen as a spike following the lower pay gaps reported in 2023. However, a longer-term view suggests a return to the profile prevalent before 2023, with the lower gap in 2023 being temporarily impacted by pay reviews benefitting lower paid roles.
-
The gender and pay profile of the senior leadership team continues to impact the gender pay gap.
-
In March 2024, there were 3 female apprentices, and 1 male apprentice, being paid on the statutory apprentice wage (lower than NLW). In March 2023, this had been more evenly balanced, with 2 x female apprentices and 2 x male. The lower, predominantly female, apprentice pay rate therefore will have slightly distorted the data.
-
In previous years, this report has detailed the impact of the Shortage Skills Allowance (SSA) paid to teaching staff in certain shortage skills areas. The highest SSA paid is £6000 per annum for some subject areas, mainly in Construction & Engineering. Although it includes a small number of female staff, the majority in receipt of the higher levels of SSA are male, due to the profile of the trades involved.
-
Other differences in mean GPG are likely to be a combination of the contributory factors outlined in the Median GPG trend below.
Analysis of the 3-year Median GPG trend: in the previous year, there was a significant reduction in the median to an all-time low; however, in 2024, the median returned to previous years’ norm.
-
A positive impact, arising from implementation of elements of the Pay Review and National Living Wage increases between April and November 2022, were evident in the GPG data of 2023. In 2024, while a higher pay award was made, the % increase was the same across all pay bands, meaning a generally higher increase in hourly rate for higher paid staff. The further NLW increase took effect in April 2024, and is not therefore reflected in this data.
-
A high proportion of female staff work in lower paid support roles, which received lower actual pay increases in terms of hourly rate, albeit the same percentage increase.
-
It is helpful to consider the distribution of female and male staff across the organisation, and the year on year fluctuations within this distribution. With the College’s relatively small number of staff, and nearly twice the number of females to males, the median GPG seems particularly sensitive to variation.
SUMMARY GENDER PAY GAP COMMENT
While some specific explanations have been identified for the LMC Gender Pay Gap, there are broader trends in play across the whole staff profile, which are common to our sector.
Comparison with data published by other NW colleges suggests that the gender of the College Principal / senior staff, alongside the extent to which there is a predominance of female staff in the lower/upper quartiles (including the fact that some lower paid and often predominantly female roles such as cleaning and catering are contracted out by some colleges and therefore not part of their pay gap calculation), can have an impact on these extremely sensitive mean and median measures.
Since one of the main factors impacting the LMC gender pay gap is the higher proportion of female staff in the lower quartiles (i.e. lower paid support roles) - a trend likely to continue, it is the case that any reversal of the gender pay gap will only be feasible alongside the ability to start to reverse the longer-term chronic depression of wages within the sector.
Angela Bathgate
Director HR Strategy & Support, November 2024


